MA Cross Death Cross on TSLA → 14 matches found
Win Rate: 50% | Best Period: 12M (+52.19%)
Speed: 380ms
█ 7 INSTITUTIONAL PLATFORMS █
Strategy Lab
Test Any Idea in Seconds
Backtest 13 trading strategies against 43 years of market data. Get results in <500ms with 11 forward return timeframes.
- 13 pre-built strategies (Percent Move, MA Cross, Reversals)
- Smart Scanner finds opportunities in real-time
- Analyzer breaks down win rate, returns, risk metrics
- Interactive charts with pattern highlighting
- Average speed: <500ms
REAL EXAMPLE
PRO TIER
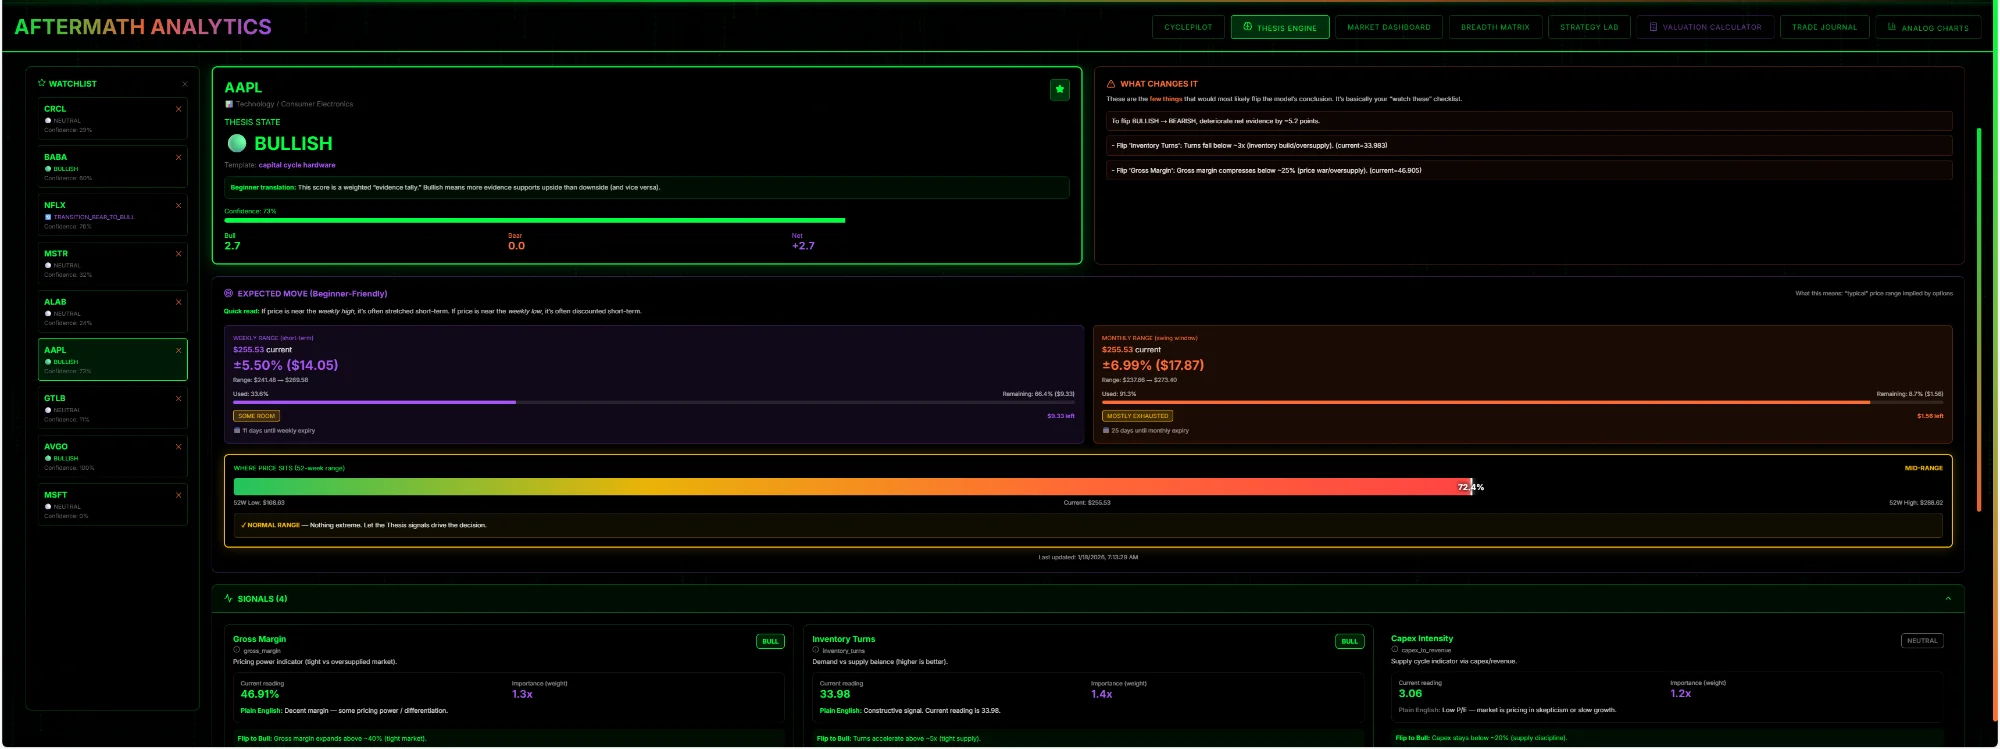
Thesis Engine
AI Fundamental Analysis
AI analyzes company fundamentals and assigns bull/bear ratings. See expected weekly/monthly moves and what changed recently.
- Bull/Bear/Transition state with confidence scoring
- Expected move predictions (week + month ranges)
- "What Changed?" tracking (earnings, upgrades, catalysts)
- Technical + fundamental signal integration
- FCF, leverage, price trend analysis
REAL EXAMPLE
NFLX → Transition_Bear_to_Bull (Low Confidence)
Expected Move: ±9.16% weekly, ±11.95% monthly
Bull Signal: 17.75% FCF margin
Bear Signal: -28.64% price trend (6M)
Expected Move: ±9.16% weekly, ±11.95% monthly
Bull Signal: 17.75% FCF margin
Bear Signal: -28.64% price trend (6M)
AI POWERED
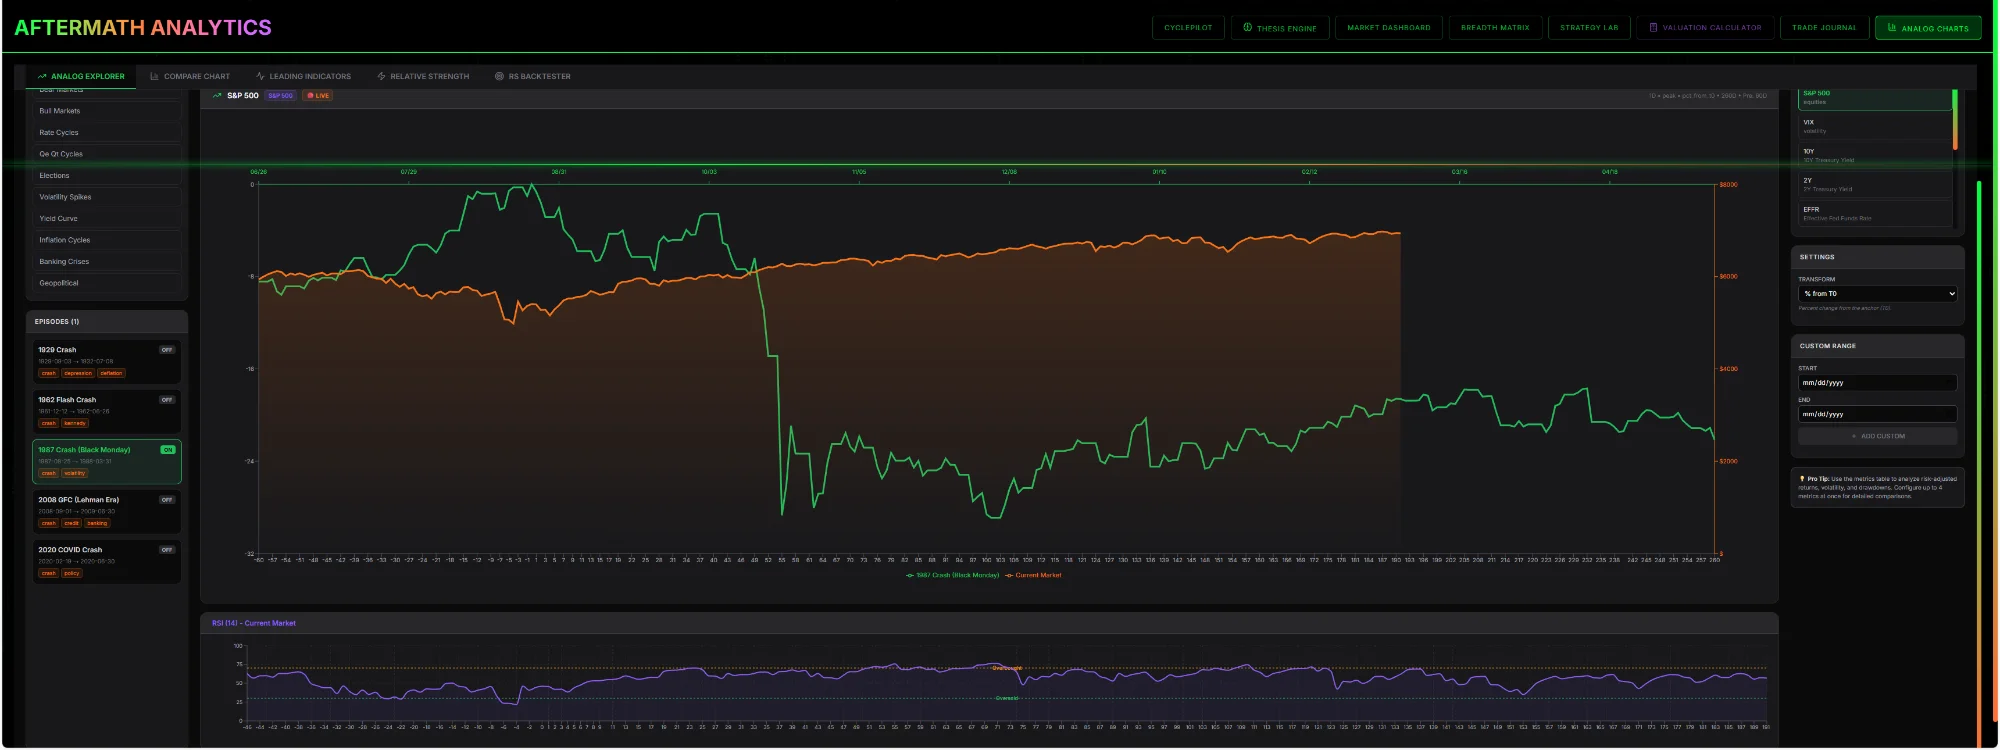
Analog Charts
History Doesn't Repeat, But It Rhymes
Compare today's market to every crash, rally, and cycle in history. See how current conditions match 2008, 2020, or any period you choose.
- Historical overlays (crashes, bull/bear markets, rate cycles)
- Leading indicator analysis (M2 leads BTC by 13 weeks)
- Relative strength scanner with backtester
- Multi-asset comparison (17 metrics available)
- Adjusts for volatility and beta
REAL EXAMPLE
How does 2025 compare to 2008?
Correlation: 23% | Volatility: 45% lower
Max DD Risk: 12% vs 57% (safer)
Correlation: 23% | Volatility: 45% lower
Max DD Risk: 12% vs 57% (safer)
HISTORICAL
Breadth Matrix
Market Internals + AI Intelligence
Track market breadth with AI-powered summaries for beginners. See participation, McClellan Oscillator, and 70+ ETF performance.
- Market breadth tracking (% above 50MA/200MA)
- McClellan Oscillator + advance/decline ratios
- ETF Performance Tracker (70+ ETFs with smart flags)
- AI summarization for beginners
- Real-time sector rotation analysis
REAL EXAMPLE
Breadth: 71% | Regime: Selective Market
Win Rate: 93% (based on 30 similar setups)
Leaders: XLRE +3.29% (9M), XLI, XLP
Risk: MODERATE | Confidence: HIGH
Win Rate: 93% (based on 30 similar setups)
Leaders: XLRE +3.29% (9M), XLI, XLP
Risk: MODERATE | Confidence: HIGH
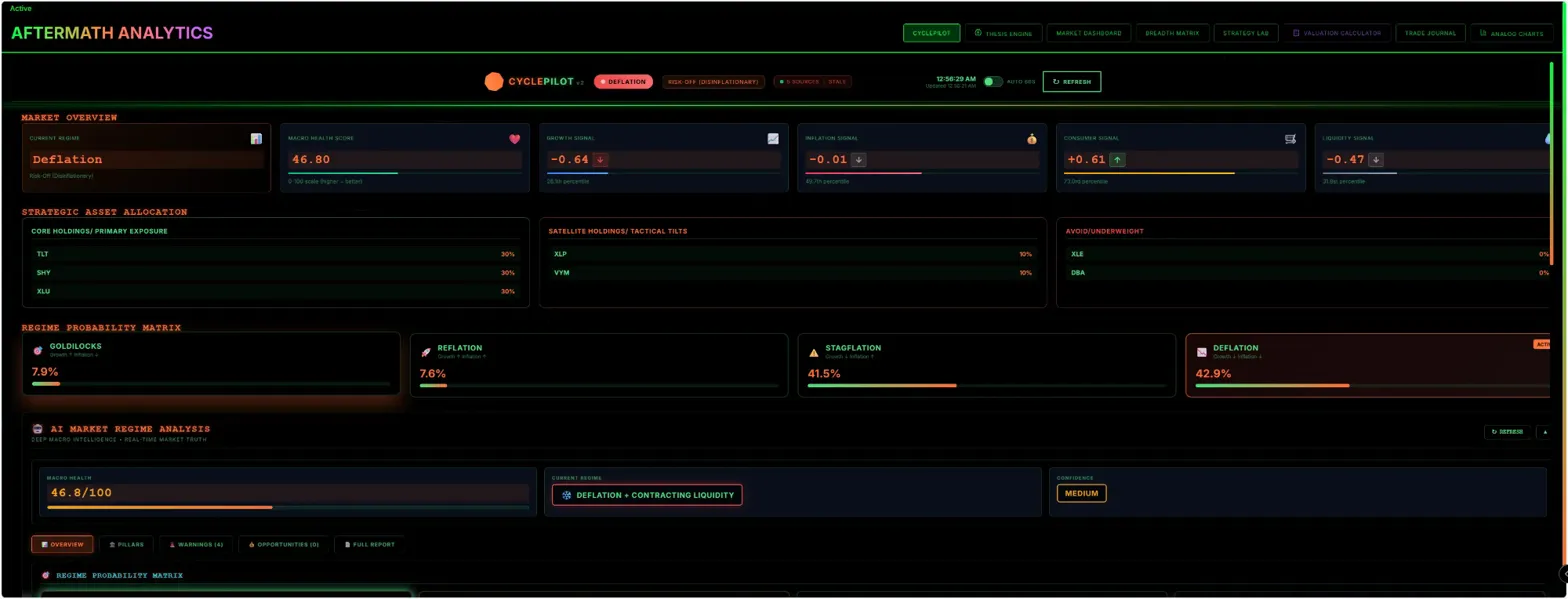
PROPRIETARY
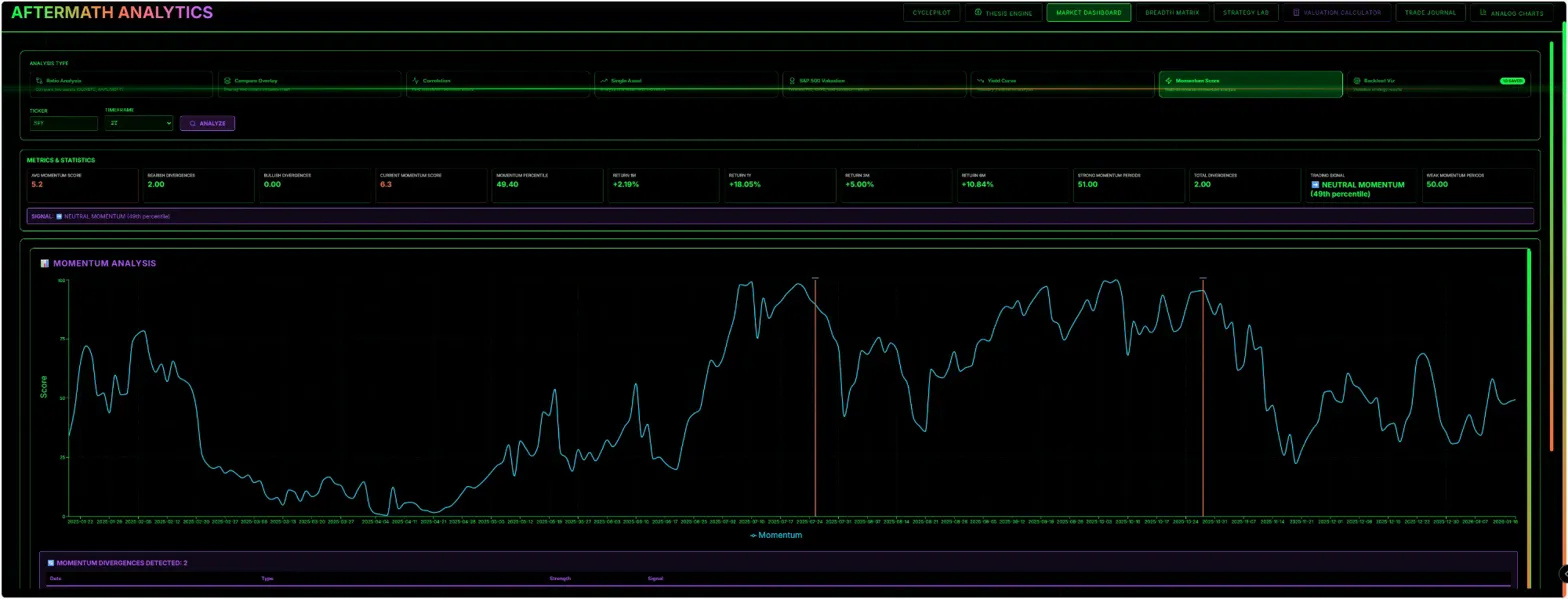
CyclePilot
Detect Market Regimes Before They Happen
Identify trending, mean-reverting, and transitional markets. Get probability scores and asset allocation recommendations.
- Market regime detection (Deflation, Stagflation, Goldilocks)
- Probability matrix for each regime
- Asset allocation recommendations
- Economic pillars analysis (Consumer, Growth, Inflation)
- AI-generated regime reports
REAL EXAMPLE
Current Regime: Deflation (42.8% probability)
Recommended: TLT (30%), SHY (30%), XLU (30%)
Avoid: XLE, DBA
Market Health: 47.3/100
Recommended: TLT (30%), SHY (30%), XLU (30%)
Avoid: XLE, DBA
Market Health: 47.3/100
AI POWERED
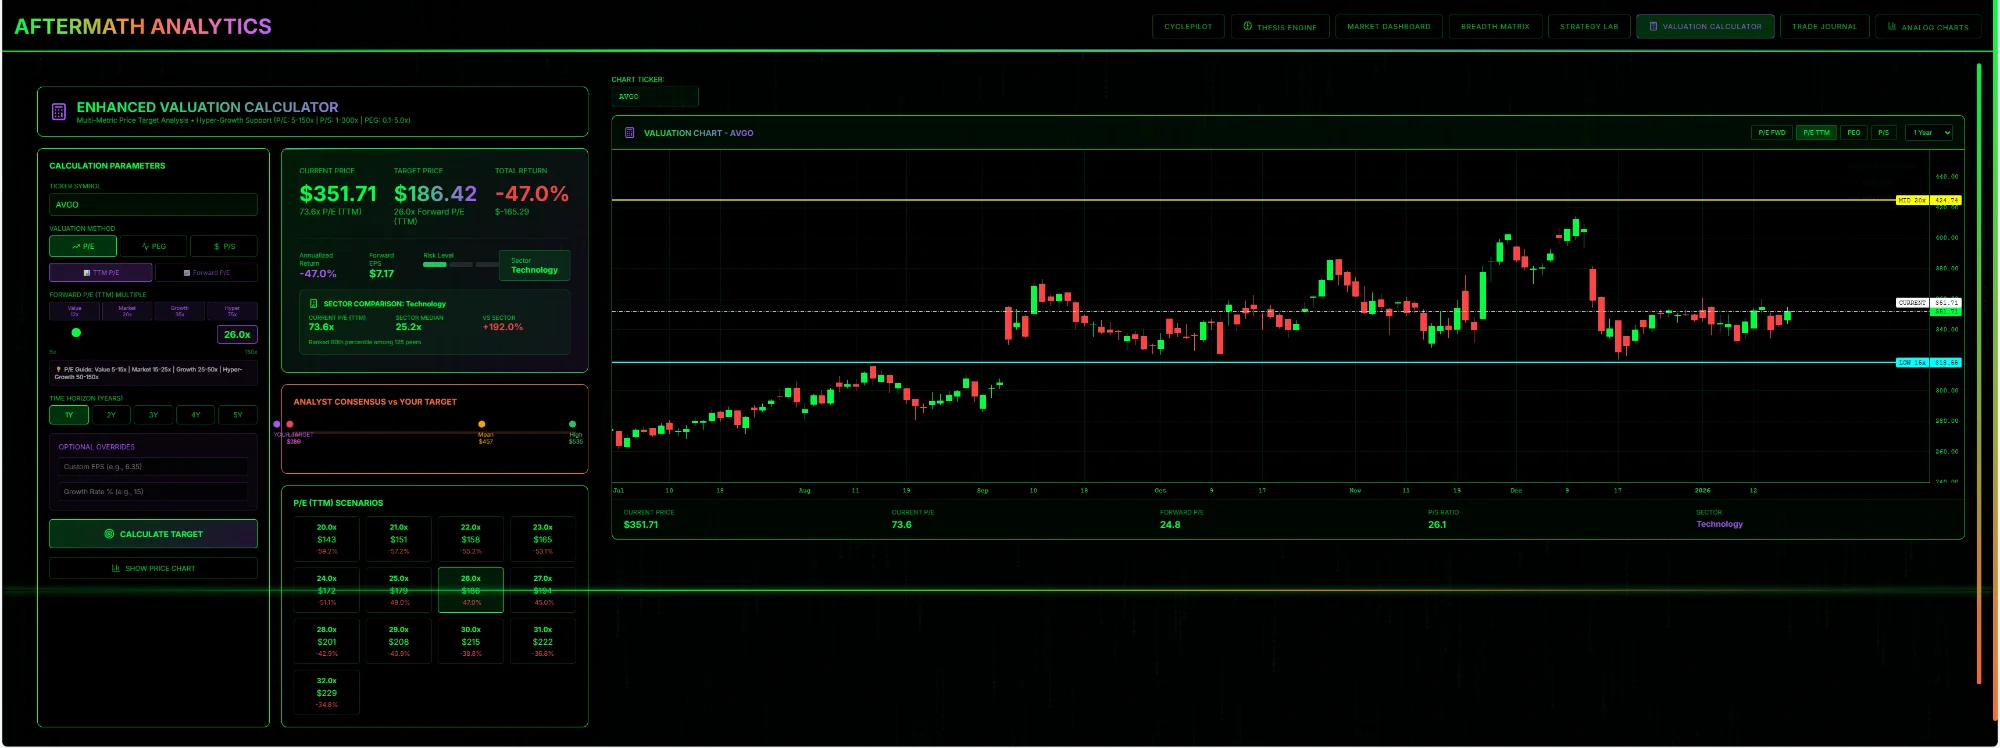
Fair Value Labs
DCF Modeling Meets Market Reality
See if a stock is overvalued or undervalued with multi-metric DCF analysis, scenario stress tests, and sector comparisons.
- Multi-metric DCF analysis
- Current vs market price comparison
- PEG ratio + forward estimates
- Sector benchmarking
- Consensus vs your target comparison
REAL EXAMPLE
AAPL Analysis:
Current Price: $255.53
Market Price: $794.09
Total Return: +210.8%
Verdict: OVERVALUED
Current Price: $255.53
Market Price: $794.09
Total Return: +210.8%
Verdict: OVERVALUED
DCF MODEL
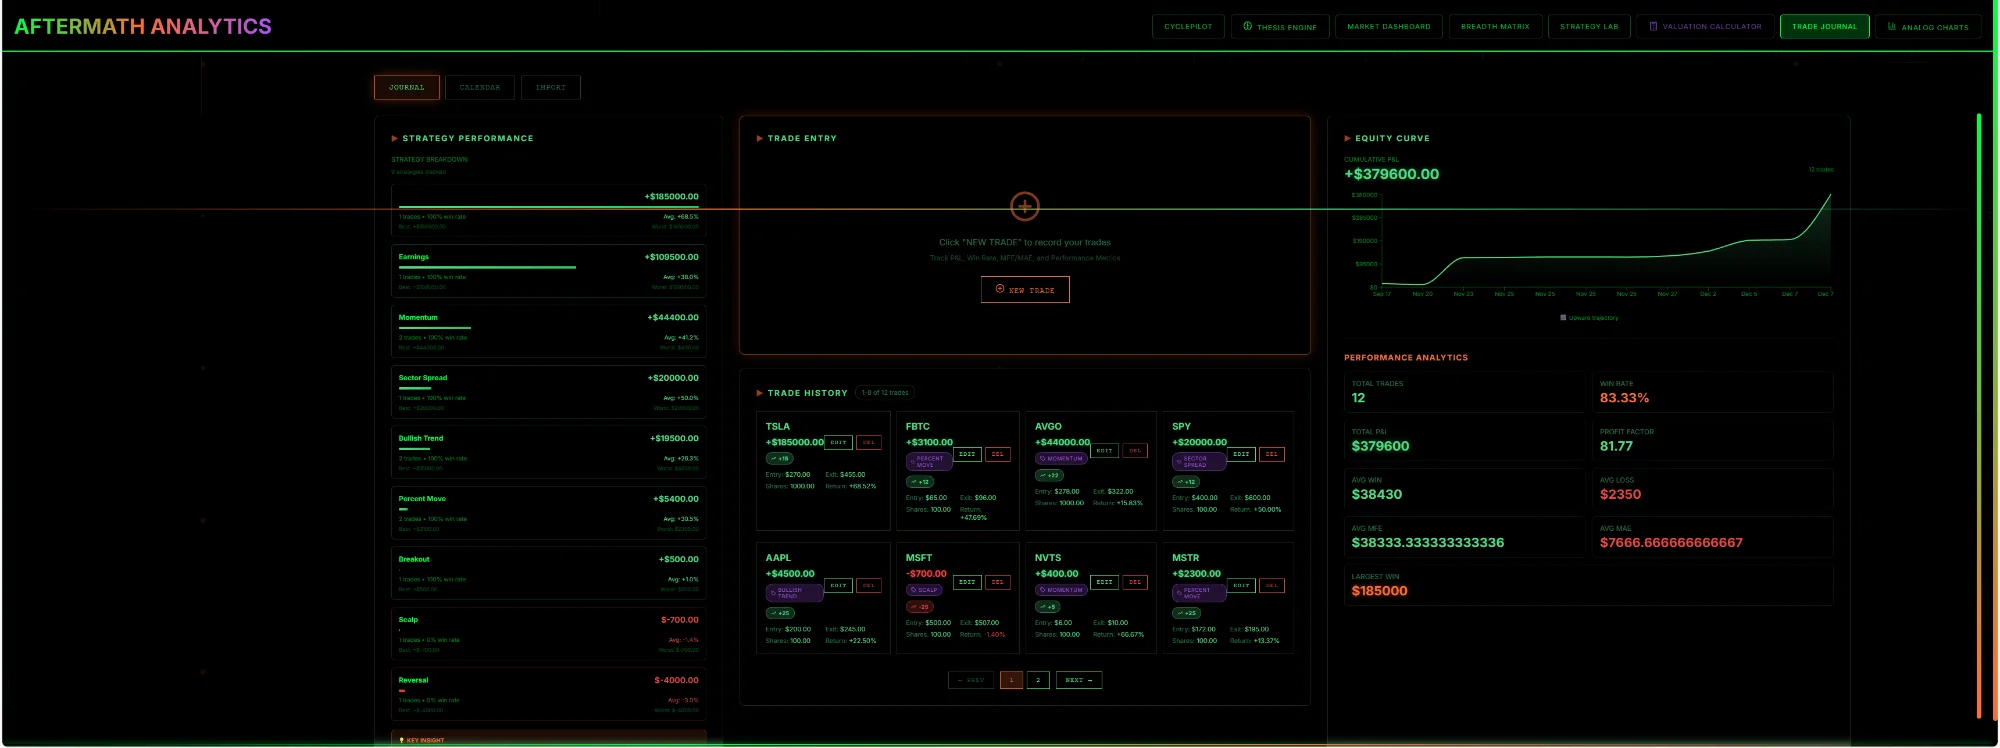
Trading Journal
Track What Actually Works
Log every trade and see which strategies actually make you money. Tag by Strategy Lab setups.
- Strategy-tagged trade logging
- Performance by setup type
- Equity curve visualization
- Win rate, Sharpe, max DD analytics
- Screenshot capture + notes
REAL EXAMPLE
Bullish Trend: +$18,500 (8.5% avg)
Earnings: +$10,500 (5.8% avg)
Total Trades: 12 | Win Rate: 83.33%
Earnings: +$10,500 (5.8% avg)
Total Trades: 12 | Win Rate: 83.33%
ANALYTICS
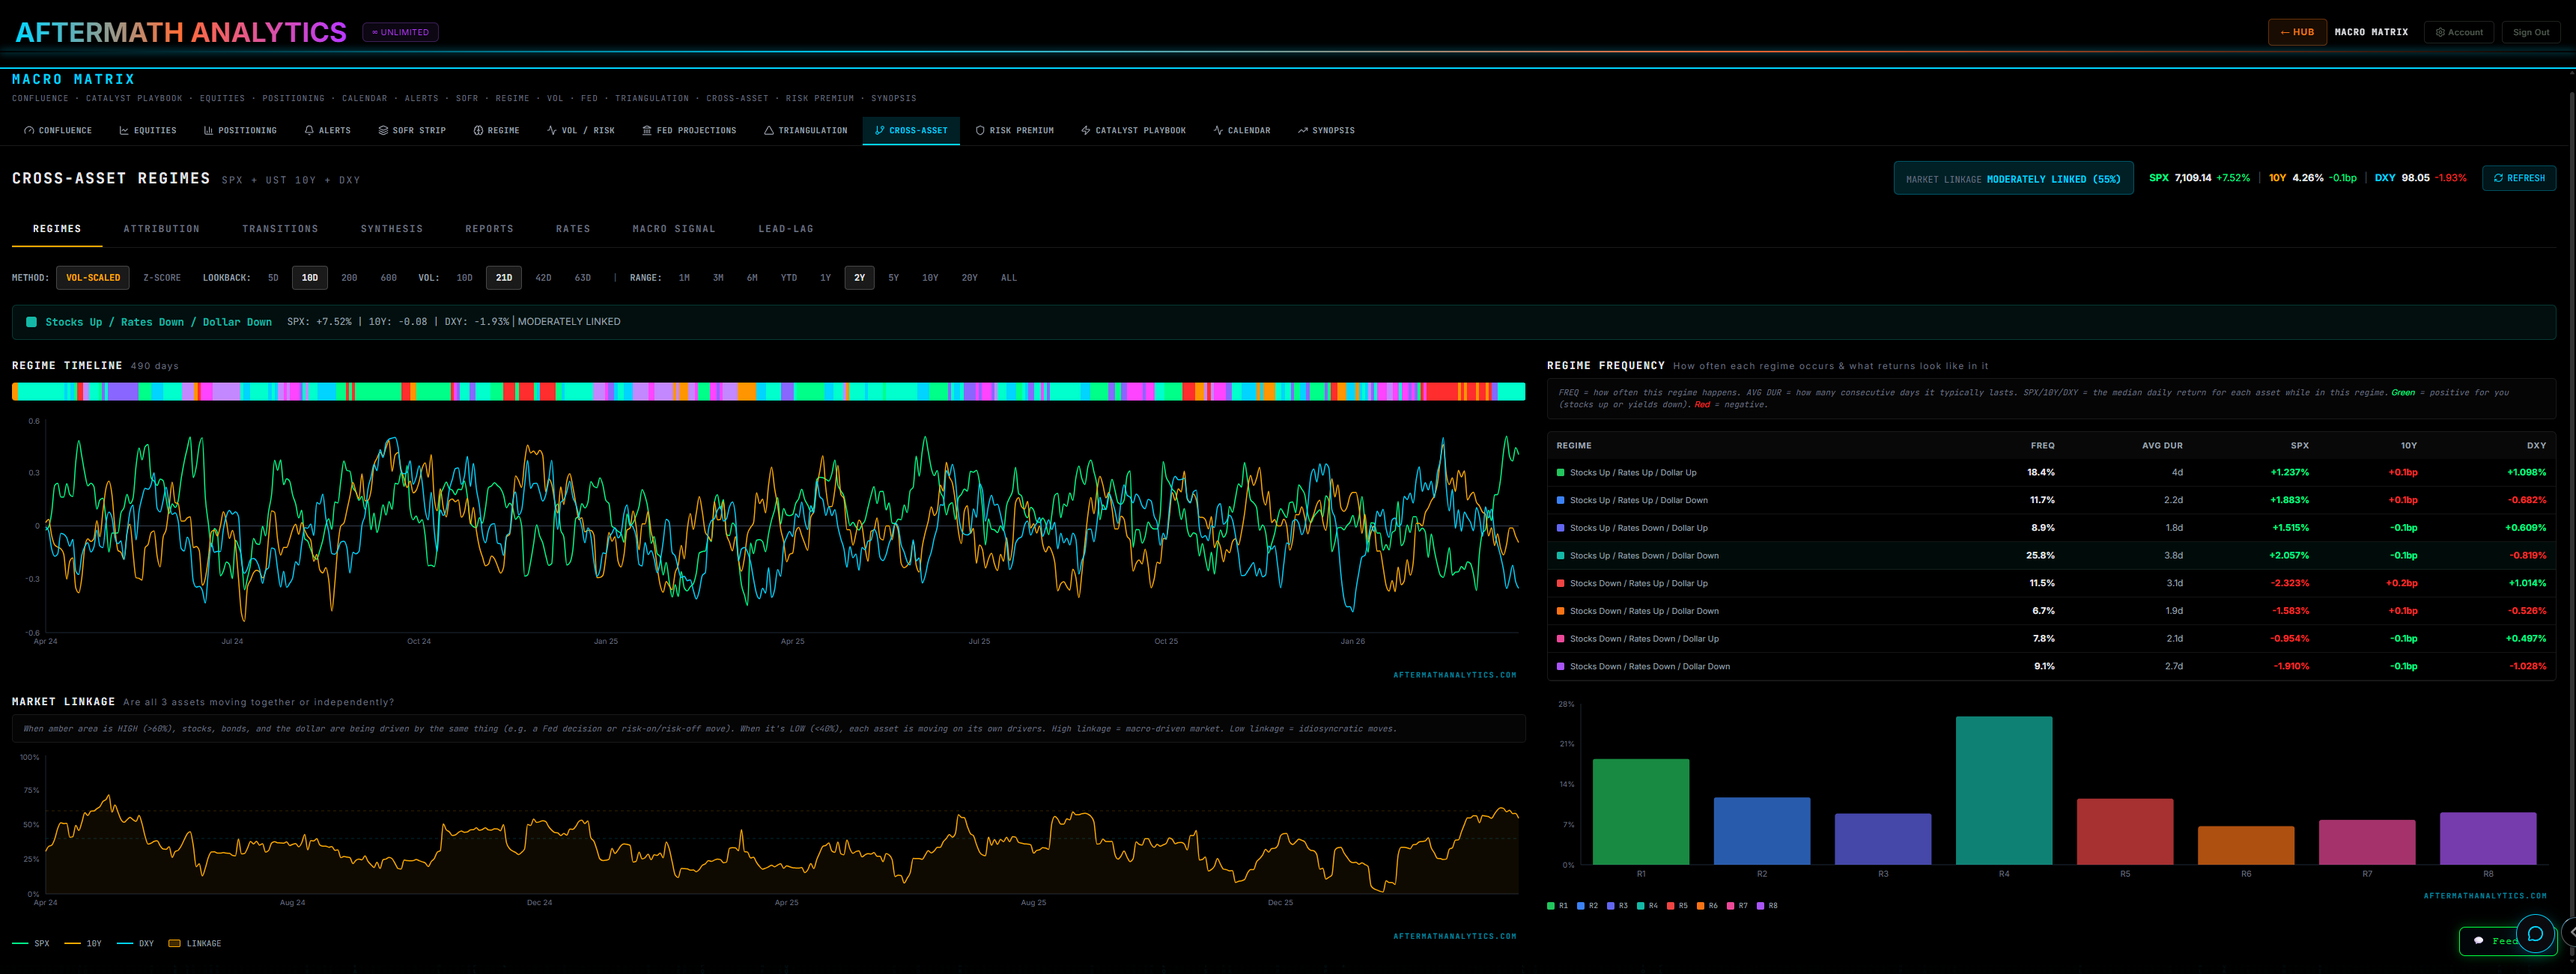
Macro Matrix
11 Engines. One Big Picture.
Decompose the market into rates, vol, regime, risk premium, cross-asset linkage, and SOFR pressure. See what's actually driving the tape today — versus what's about to.
- Cross-asset regime detection (8 regimes, market linkage)
- Rate path projections + Fed pricing
- Vol surface, term structure, SKEW
- SOFR strip, repo stress signals
- Catalyst playbook + macro alerts
REAL EXAMPLE
Stocks Up / Rates Down / Dollar Down
Frequency: 25.8% — most common regime
Avg duration: 3.8d | SPX +2.06% median
Frequency: 25.8% — most common regime
Avg duration: 3.8d | SPX +2.06% median
PRO TIER
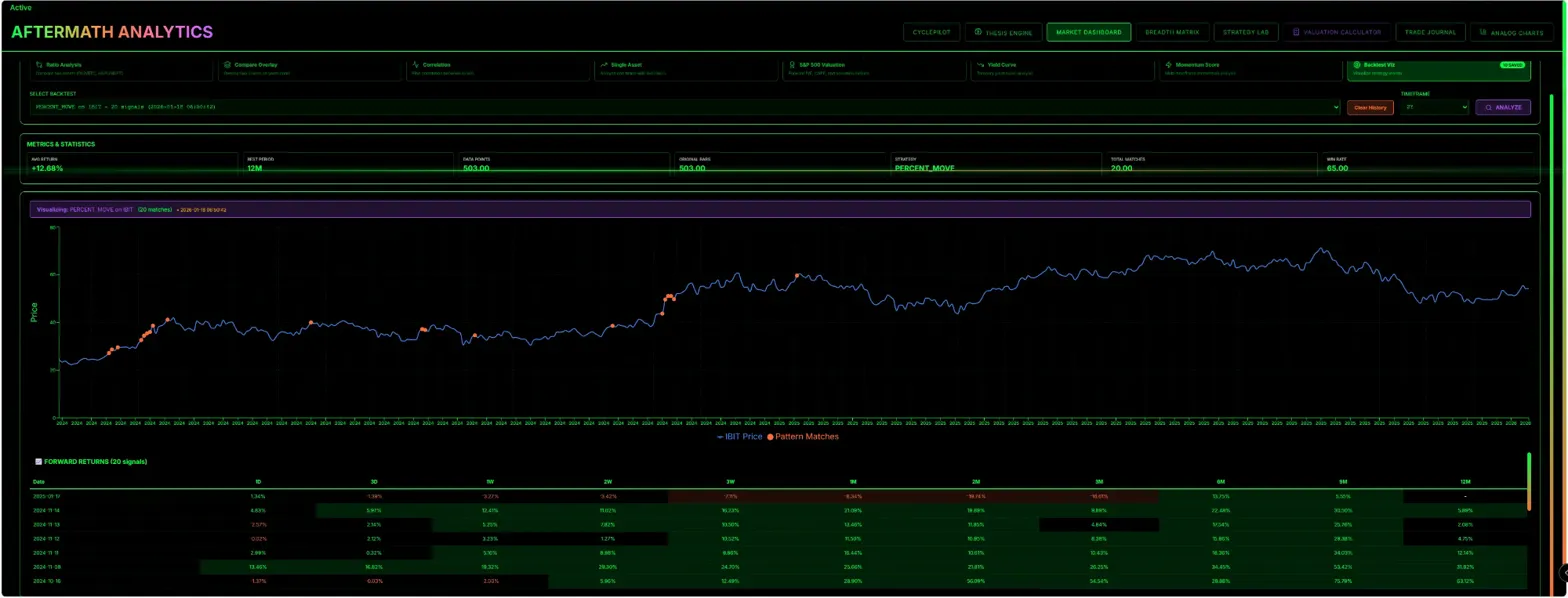
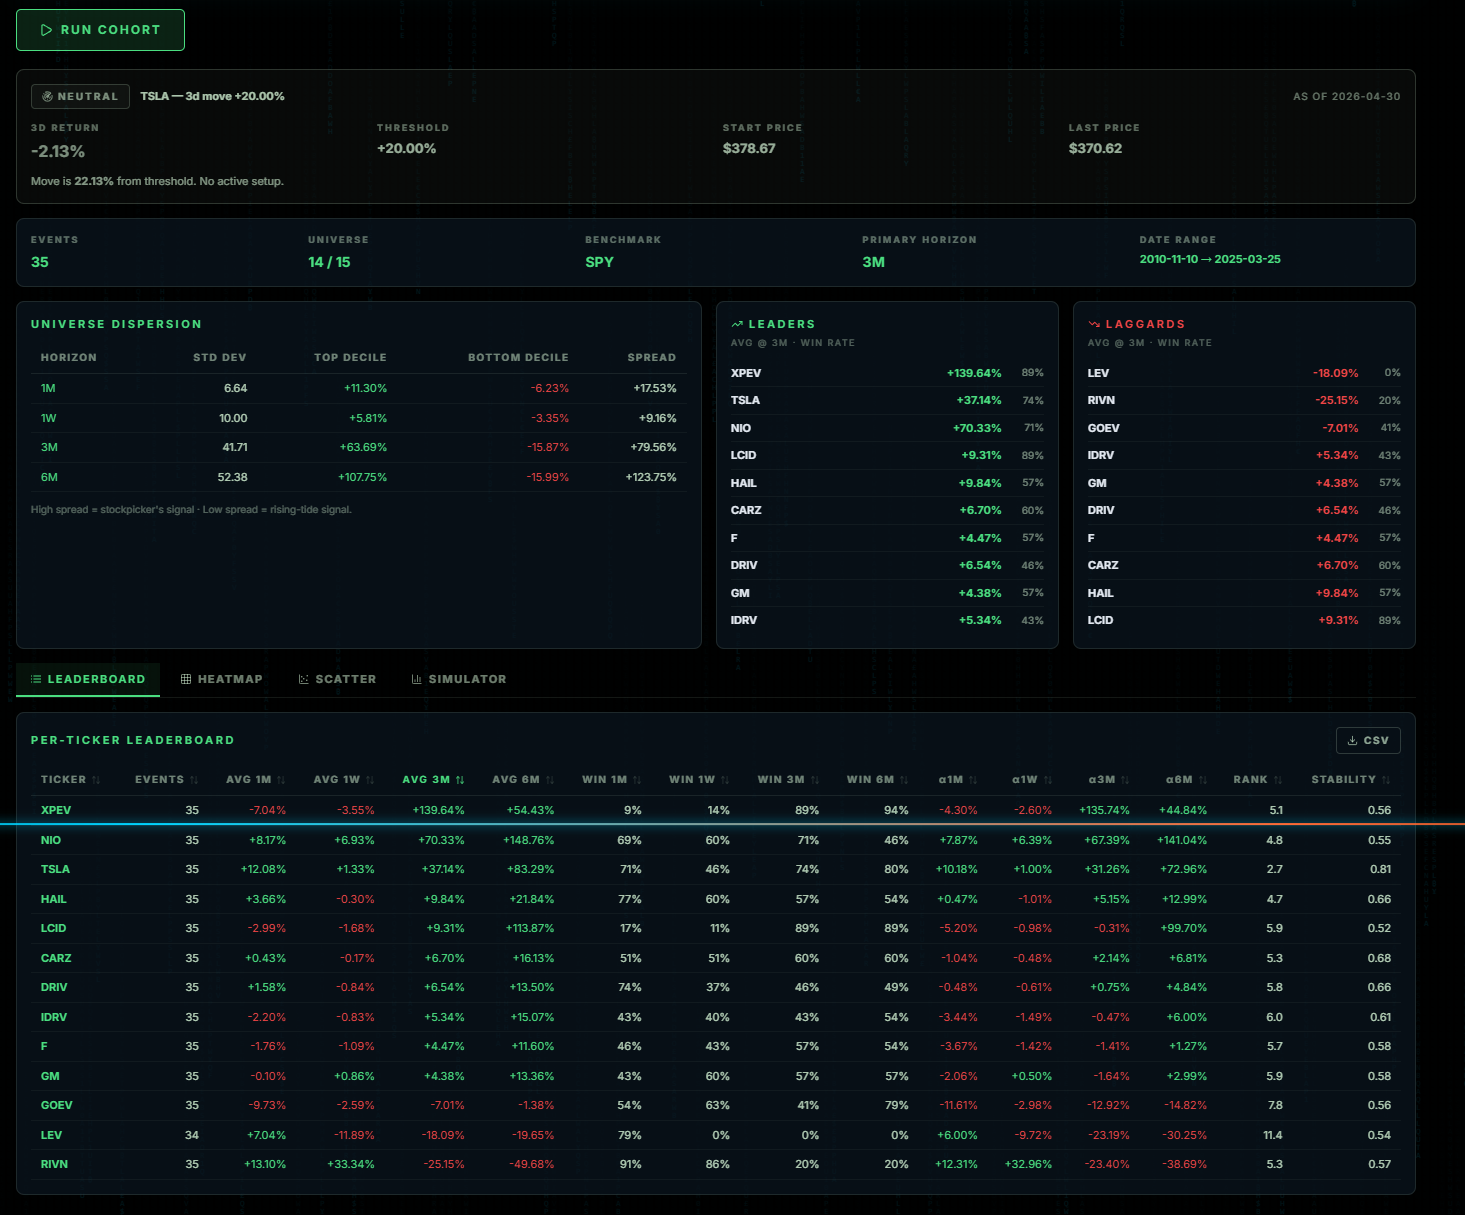
Multi-Ticker Lab
Test the Whole Industry Against the Leader
Tesla just ripped +20% in 3 days. Did the rest of the EV space follow — or does the leader always get there first? Pick your universe, set the trigger event, and see exactly how every related ticker behaved historically. Then run the same study against your own peer group before you trade the rotation.
- Cohort engine — event study across any custom universe
- Per-ticker leaderboard with α decay tracking
- Heatmap, scatter, and forward simulator views
- Custom universes (S&P 500, sector ETFs, your watchlist)
- Stability scoring across 1W / 1M / 3M / 6M horizons
REAL EXAMPLE — TSLA +20% / 3d → EV cohort
XPEV: +139.64% over 3M (89% win rate)
NIO: +70.33% (71% win rate) | TSLA itself: +37.14%
Median spread +79.56% — strong stockpicker signal
NIO: +70.33% (71% win rate) | TSLA itself: +37.14%
Median spread +79.56% — strong stockpicker signal
PRO TIER
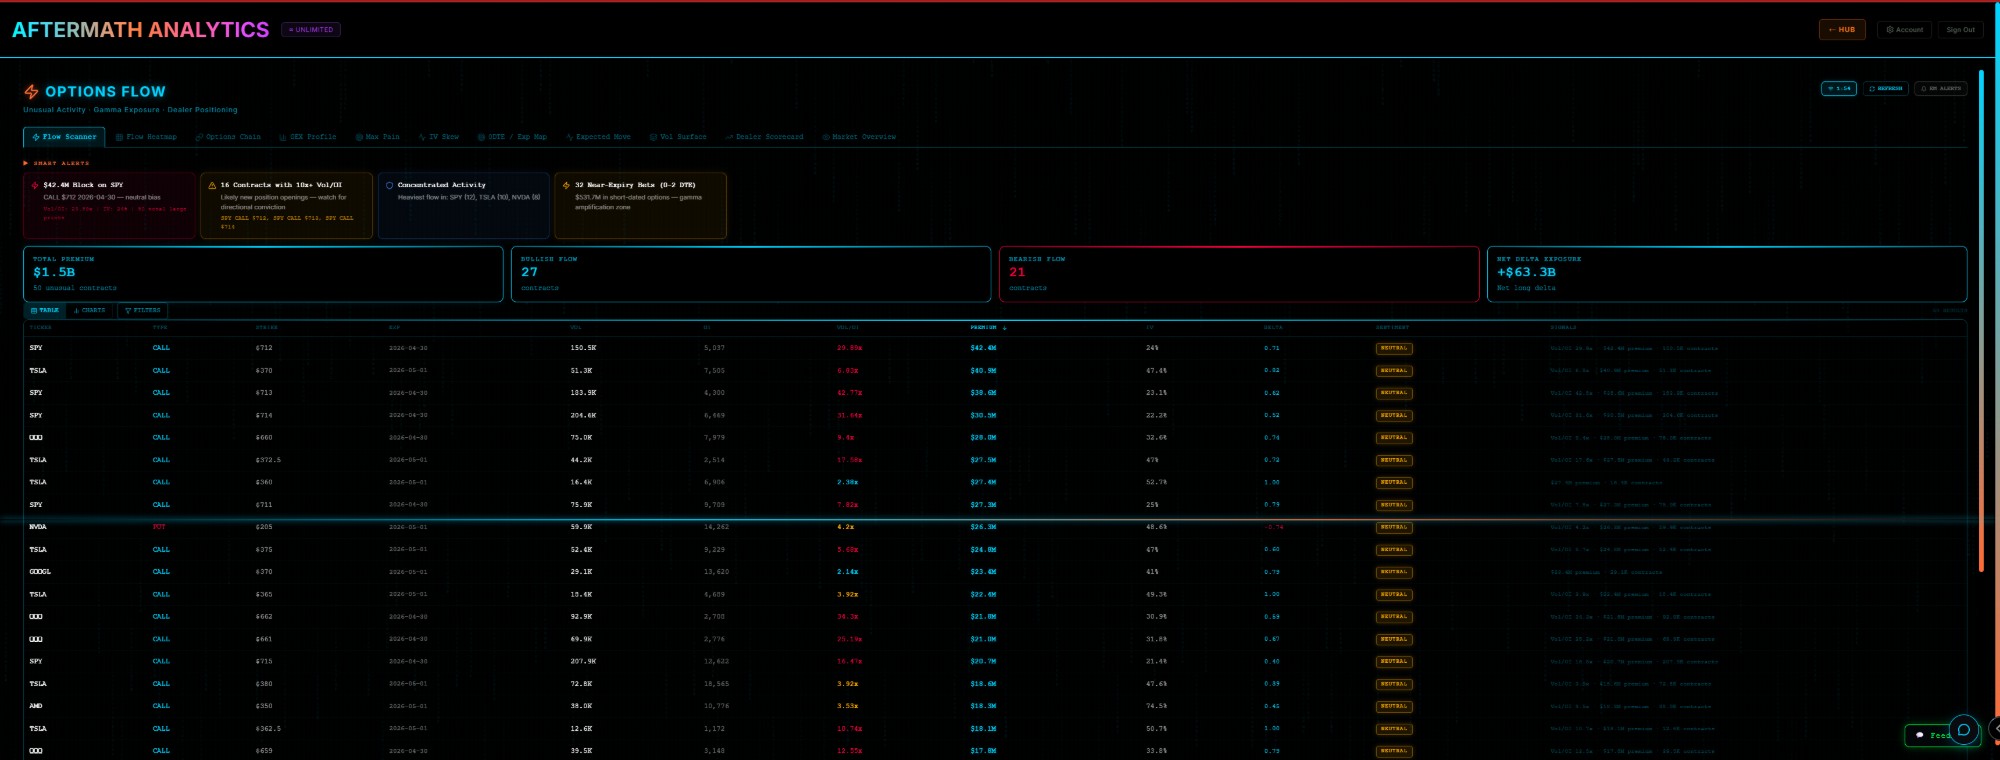
Options Flow
See What the Smart Money Is Buying
Real-time unusual options activity, gamma exposure, dealer positioning, and dark pool signals. Spot block trades and unusual size before the headline catches up.
- Smart Alerts — block trades, 10x+ Vol/OI, near-expiry bets
- Gamma Exposure profile + dealer positioning
- Volatility surface, term structure, SKEW curve
- Bullish vs bearish flow tally + net delta exposure
- Filterable scanner: type, strike, IV, sentiment
REAL EXAMPLE
$42.4M block on SPY $712 calls
150K volume vs 5K OI → 29.85x ratio
Total premium today: $1.5B across 50 unusual contracts
150K volume vs 5K OI → 29.85x ratio
Total premium today: $1.5B across 50 unusual contracts
QUANT TIER
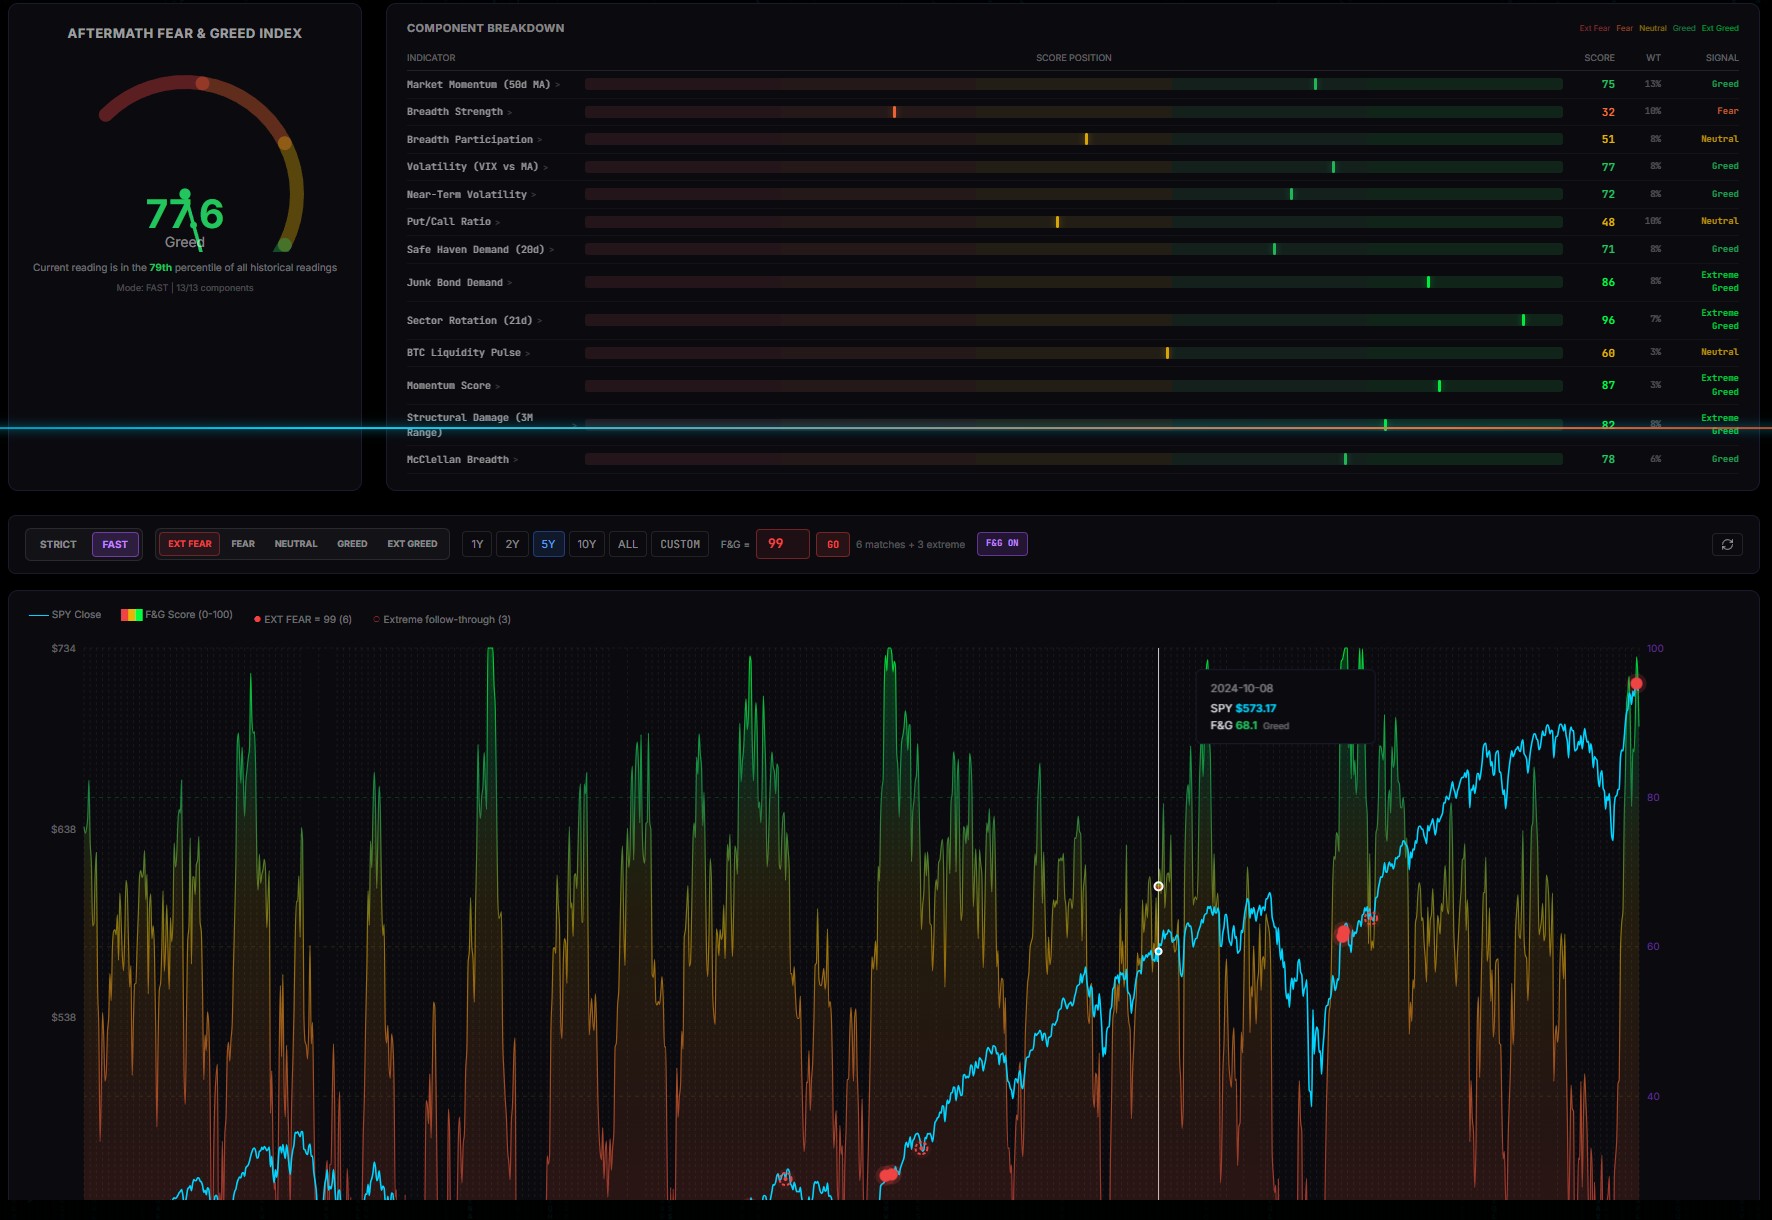
Fear & Greed Index
Sentiment, Decoded
A 13-component proprietary sentiment gauge — momentum, breadth, volatility, put/call, junk bond demand, sector rotation, structural damage, and more. Updated continuously, backtest-able since 2018.
- 13 weighted components (vs CNN's 7)
- 0–100 score with regime classification
- Historical overlay vs SPY price action
- Extreme fear / greed event flagging
- Contrarian setup backtests with forward returns
REAL EXAMPLE
F&G reading: 99 (Extreme Greed)
79th percentile of all historical readings
6 prior matches → 3 extreme follow-throughs
79th percentile of all historical readings
6 prior matches → 3 extreme follow-throughs
INCLUDED IN BASIC